Determining whether someone is healthy is a complex task. Medicine aims to capture this via a variety of measures – your blood pressure, your temperature, the paperwork you fill out at the doctor’s office, your annual physical exam, etc.
While an annual doctor’s visit can give you a lot of helpful guidance and reassurance that today you are healthy, a 15 minute visit once per year misses the context of your daily routine and is often not enough to address all of your medical questions. In fact, a recent study demonstrated that it would take a primary doctor 26.7 hours per day to manage all the work required for a standard panel of 2500 patients.
Some people have tried to complement traditional medical care with wearable device data. While these devices do show promise in monitoring chronic disease and in their predictive potential, most people only receive raw data that is hard to relate to their symptoms or specific conditions. Is there a way to monitor your health on a more consistent basis, perhaps outside of the doctor’s office and with tools that are becoming more accessible to the average person? Our most recent feature, Radar, aims to address this problem – to give people more routine insights into their day-to-day health by combining metrics from wearable devices, lab tests, and self-reported data.
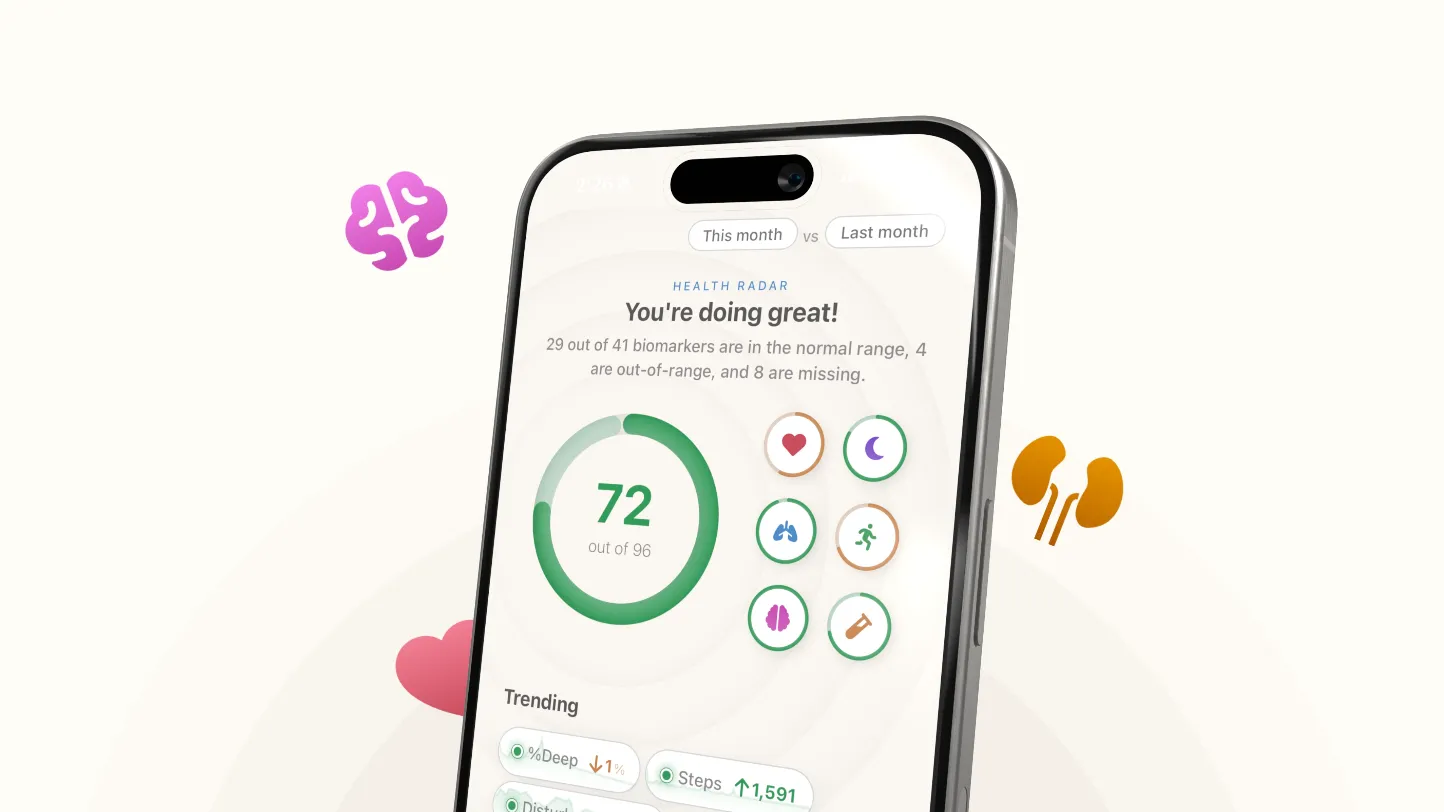 Radar shows you a comprehensive score and six subcategory markers.
Our considerations as we designed Radar
As we developed our scoring system, we focused on three key principles:
- Broad applicability: Our tool should be effective and meaningful across various clinical scenarios and diverse patient populations.
- User-friendly accessibility: Using Radar should be easy and convenient.
- Transparency: Users should receive clear and understandable information.
To achieve these objectives, the design considers evidence-based recommendations and research studies. Radar weighs data points from wearable sensors, lab testing, and health questionnaires to calculate a single comprehensive score that is composed of six subcategories: heart health, lung health, kidney and liver health, mental health, sleep health, and activity.
The science behind Radar
Radar is currently composed of approximately 40 different measurements. These were chosen by combining recommended guidelines from the United States Preventive Service Task Force, the American College of Cardiology, the American Academy of Family Physicians, amongst others.
The metrics behind Radar
| Heart | Mental Health | Lungs | Sleep | Kidney/Liver | Physical Fitness |
|---|---|---|---|---|---|
| Resting BPM | PHQ9 | VO2 max | Deep sleep % | Creatinine | Cardio mins per day |
| Heart Rate Recovery | GAD7 | Oxygen | REM % | GFR | High Intensity Cardio mins per day |
| Average HRV | Breaths/min | Sleep duration | Albumin | Strength Training mins per day | |
| Abnormal ECGs | Smoking Status | Sleep onset | Protein | Steps per day | |
| Irregular Rhythm Notifications | Sleep HR | ALT | |||
| Heart Attack Risk | Sleep HRV | Hemoglobin | |||
| Average Blood Pressure | Breathing disturbances | ||||
| A1c | Sleep blood oxygen | ||||
| Glucose (fasting) | STOP BANG | ||||
| LDL | |||||
| HDL | |||||
| Total cholesterol | |||||
| Triglycerides | |||||
| BMI |
We focused on using markers that could be valid and meaningful across different clinical scenarios and patient populations.
Wearable device sensor data
Phones and wearable devices capture hundreds of individual markers per week for the average user. Many of these, like heart rate or oxygen saturation are reflective of the vital signs captured during a doctor’s visit. These can also be helpful in gauging various issues, like cardiovascular health or sleep patterns. Resting heart rate provides a helpful example. Over time research has shown that a higher resting heart rate can indicate a greater risk for cardiovascular disease. A 2017 meta analysis re-emphasized this positive correlation noting that a higher resting heart rate predicted an increased risk of stroke, heart failure, heart disease, cancer, and all-cause mortality across various populations.
These data points can be quite powerful as several studies have shown promise in predicting various health conditions including Parkinson’s disease, atrial fibrillation, and depression.
Biometrics from lab testing
Lab testing is standard practice in medical care. Some lab tests provide direct information about the function of an organ system, while others indirectly signal how your organs are working together to tackle necessary tasks. We chose specific biomarkers that are broadly applicable and that have concrete meaning independent of a person’s specific history.
One example of this is albumin – a commonly measured serum protein. Albumin, which is often overlooked in routine clinical assessments, is a critical biomarker with significant predictive value for morbidity and mortality across various patient populations. This protein has been researched in surgical patients, individuals hospitalized for COVID-19, those with chronic illnesses, and healthy subjects. In a study involving over 54,000 patients undergoing major non-cardiac surgery, a decrease in serum albumin from >46 g/L to <21 g/L was associated with an exponential increase in 30-day mortality rates from <1% to 29% and morbidity rates from 10% to 65%. Even within the normal range of albumin levels, slight decreases are predictive of adverse outcomes, highlighting its sensitivity as an indicator of preclinical disease and overall health.
Other markers included in Radar are LDL cholesterol (a useful marker in the management of cardiovascular disease), hemoglobin A1c (commonly used for detecting and managing diabetes, which also has implications for all-cause mortality), and creatinine (a marker of kidney function and helpful in predicting outcomes for specific populations).
Health questionnaires and screenings
Some aspects of health are not as easily measured by vital signs or lab tests. To capture some of these areas we include assessments on mental health, validated cardiovascular risk assessments, and sleep questionnaires. When using Radar, there is an option to complete these personal health assessments directly in the Empirical Health app.
One of these assessments, the Patient Health Questionnaire-9, is a commonly used tool to screen for and assess the severity of depression. The scores from this tool have a high sensitivity and specificity for major depressive disorder and are often used in studies to explore the connections between mental health and other physical health conditions. A 2023 study provides a helpful example of its application. In this study of over 23,000 individuals, researchers noted a higher risk for all-cause mortality among adults with moderate to severe depressive symptoms, as measured by the PHQ-9, compared to those without depressive symptoms.
The calculation that puts it all together
To create Empirical Health’s composite score we benchmarked individual metrics against medical norms and population data. For sensor data, like HRV, a user receives full credit for a value in the normal range, extra credit if the value is in the top 25% of all Empirical Health users, and no credit if the value falls outside of the normal range. Similarly, for lab tests like Hemoglobin A1c, a user can get partial credit for being in the prediabetes range (under 6.4%), extra credit for being in the normal range (under 5.7%), and no credit for being outside of the normal range (6.5% or higher).
Each value within a subcategory is weighted in consideration against the other variables that make up that subcategory. For lung health, for example, a user’s smoking status makes up almost half of the total subcategory score.
The composite score is similarly weighted, with heart health and mental health accounting for 50% of the total scoring due to the known impact of these variables on individual and population health.
How do we ensure safety?
A comprehensive health score can be a useful tool to help people engage in their health more meaningfully. However, the complexities of the human body make the score far from perfect. At this time the score is not meant to be diagnostic or predictive of disease. It is meant to be a starting point for people to understand the information they may already have access to, as well as the information that is missing to better protect their health. Our goal is to empower people with actionable insights for health improvement.
We encourage people to engage with their primary care doctors for routine examinations or to seek care when they are having symptoms that are bothering them. In an effort to close the loop between data and healthcare access, we have an in-house medical team that can answer questions via chat or see patients for full medical visits.
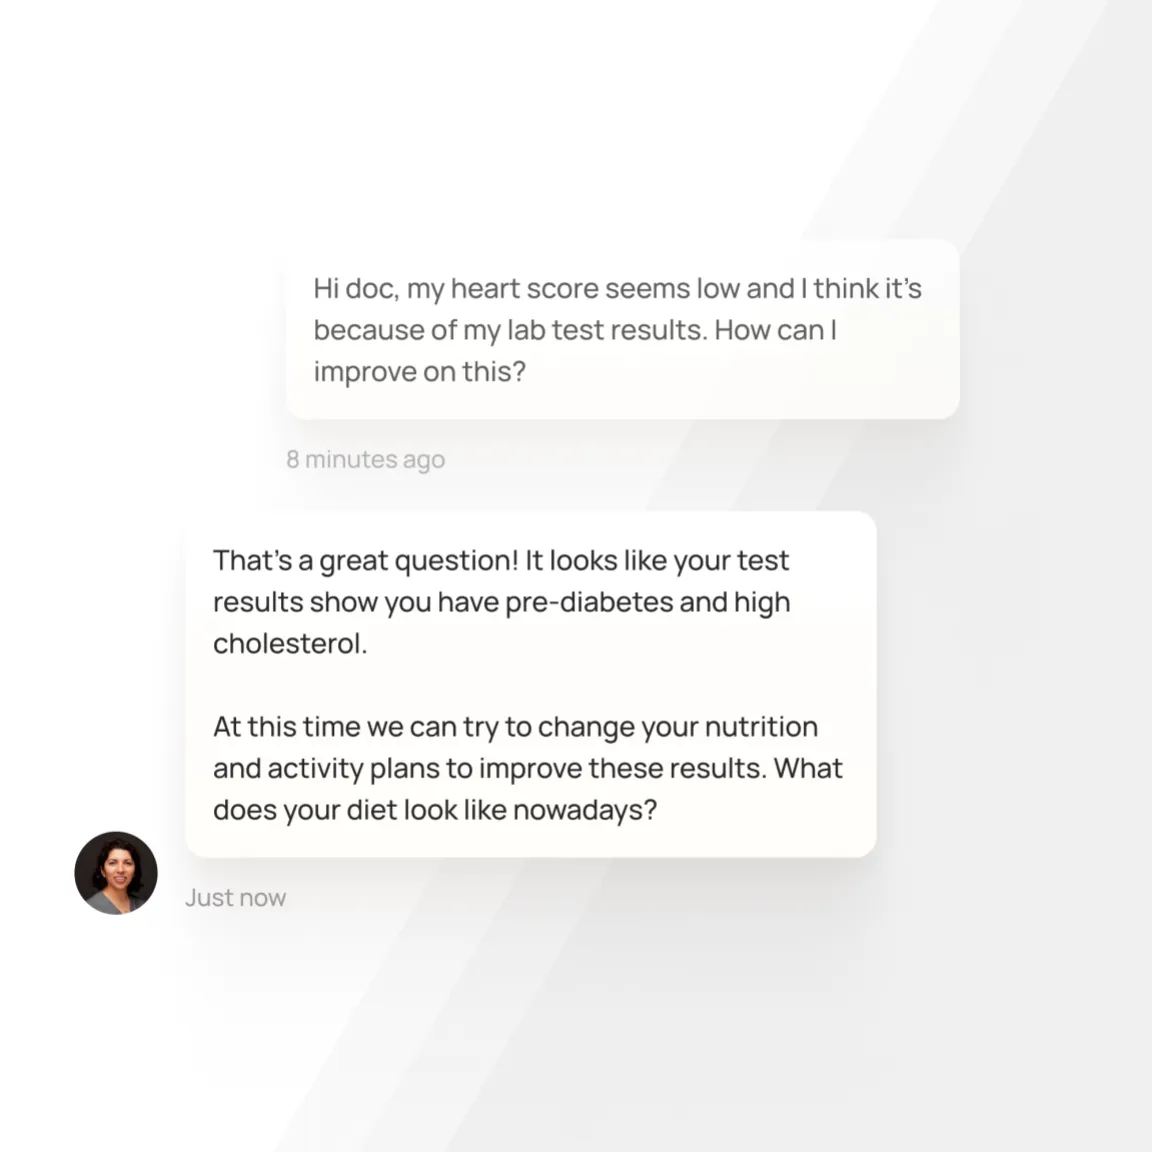 We make it easy to chat with a doctor directly in the Empirical Health app.
Where do we go from here?
At Empirical Health, Radar is just the beginning. As we continue on our journey to help people be healthier and happier, we see the potential of health data to achieve precision and personalization. Some of our future projects include:
- Expanding insights into other components of health, like reproduction and fertility, musculoskeletal health, skin health, etc.
- Adding lab values and metrics from other commonly used devices, like continuous glucose monitors.
- Using machine learning algorithms to process data better and to detect future conditions.
- In-app programming to support all health components and create personalized care plans that include lifestyle coaching.
- Continuous improvement of the scoring system to better reflect health status and long term outcomes.
- Tailoring scores to specific cases including individual baselines, progress, and health conditions.
Check out Radar and join us on our vision to transform healthcare!
Get your free 30-day heart health guide
Evidence-based steps to optimize your heart health.