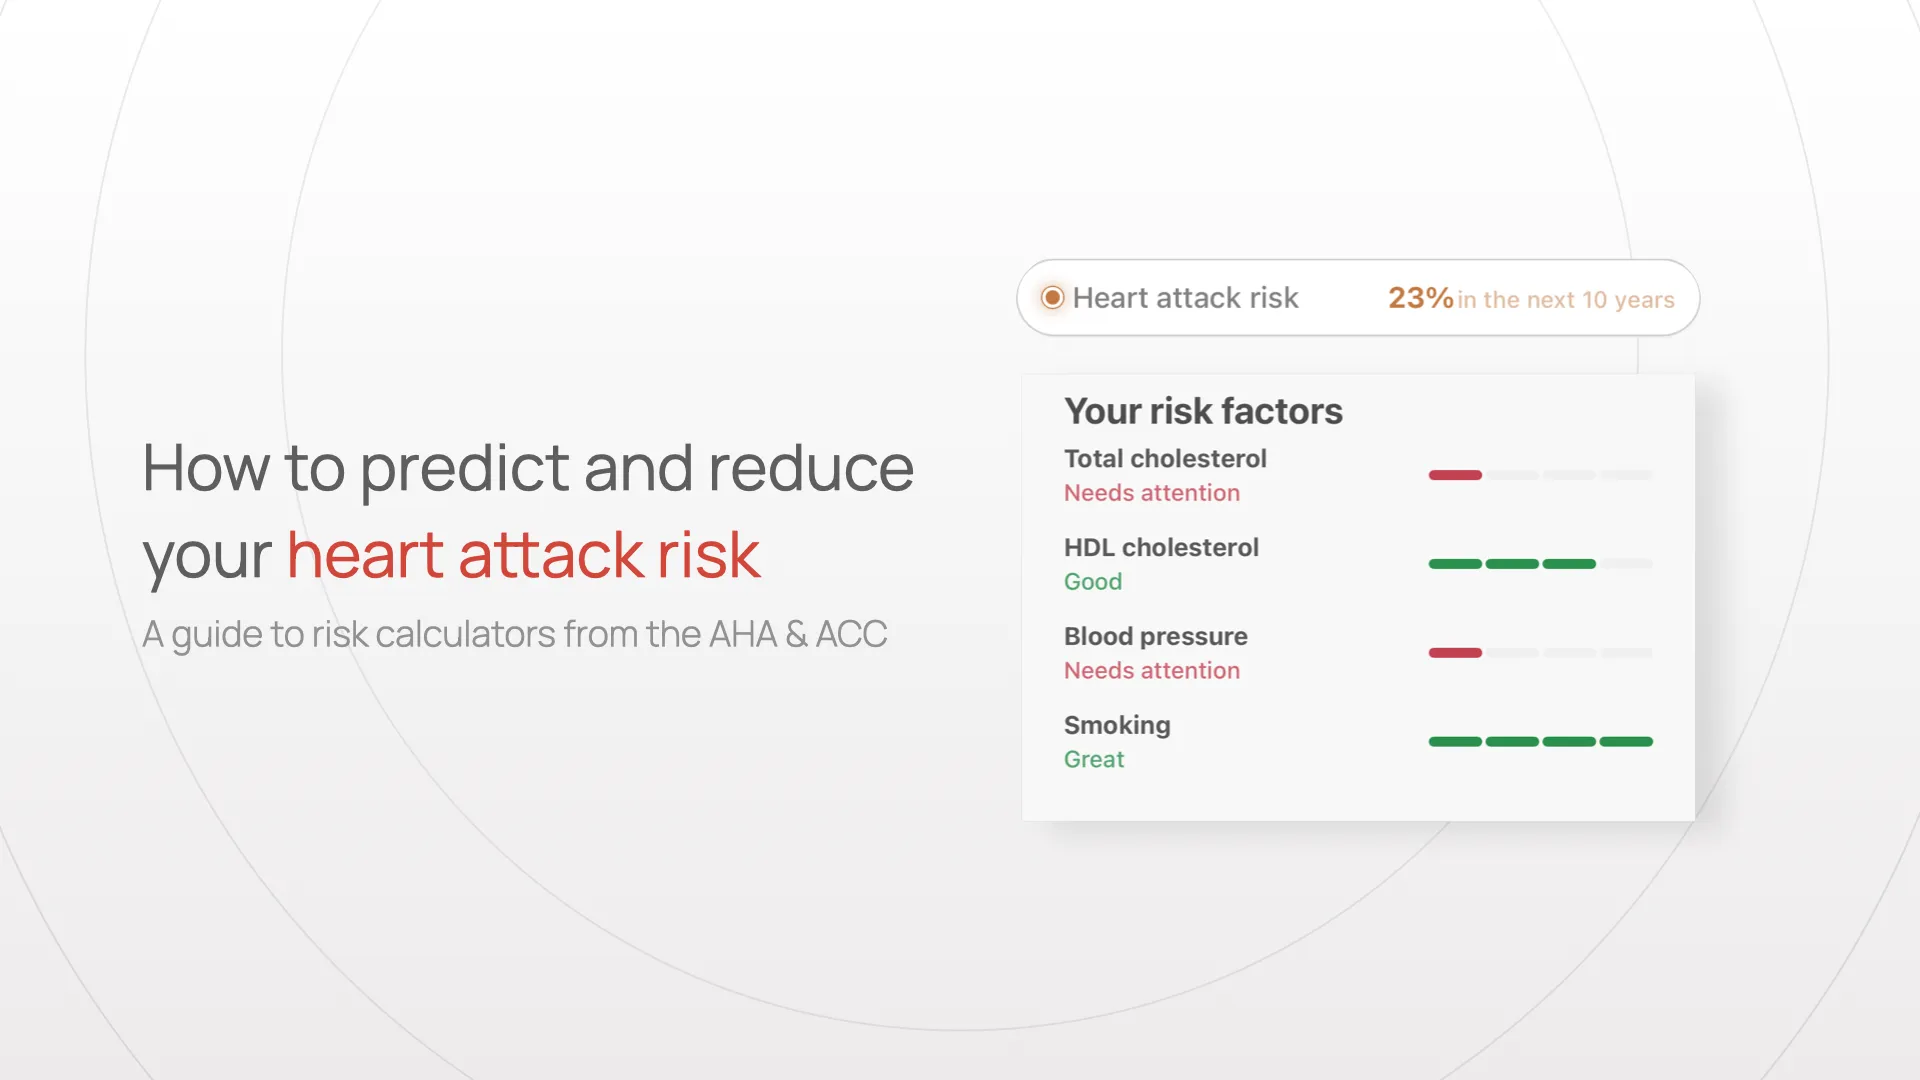
Heart disease kills more people than all cancers combined, yet is highly preventable:
- For <$200 of blood tests, you can predict both your 10-year and lifetime risk of a heart attack.
- Medications like statins are cheap—around $5 per month.
- Nutrition and exercise have an outsized effect on heart health.
805,000 people have a heart attack each year in just the US. 80% of those are preventable. For each of us as individuals, heart attack risk prediction is an example of a statistical model that can save your life. For all of us as a society, at an average medical cost of $20,000 per heart attack, we could save $129 billion per year.
The rest of this post will cover the science of predicting heart attacks, specific biomarkers and blood tests (including advanced biomarkers like ApoB, hs-CRP, and Lp(a)), and how to calculate lifetime and 10-year risk of a heart attack.

Quick history: the Framingham Risk Score
The first major heart attack risk calculator came from the Framingham Heart Study. The study started in 1948, enrolled 5,209 healthy adults from Framingham, Massachusetts (a town across the lake from a Twinkie factory), and then followed them for decades to understand what factors led to cardiovascular disease. By 1957, researchers had identified high blood pressure and high cholesterol as major risk factors; by 1961, cigarette smoking, obesity, and physical inactivity were added to the list.
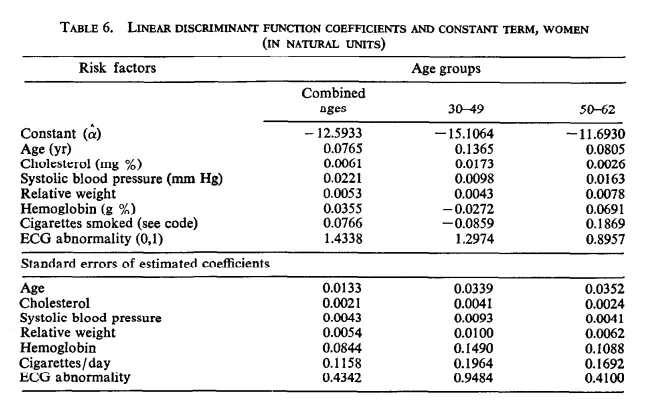
In 1976, an NIH statistician named Jeanne Truet published a paper that trained a multivariate logistic regression model on the Framingham data. It identified 7 risk factors: age, blood pressure, cholesterol, weight, hemoglobin, smoking, and ECG abnormalities. The coefficients are few enough that we can show them in this table from the original paper:

Source: “Multivariate analysis of the risk of coronary heart disease in Framingham”, Truett et al.
The Framingham Risk score’s accuracy was about 76%, as measured by c-statistic (area under the ROC curve). In this scale, 50% would represent random chance and 100% represents a perfect predictor. Modern heart attack risk calculators achieve accuracies between 79%-89%. They use the same basic approach, but add more biomarkers and introduce more complex modeling of nonlinear effects.
Let’s skip ahead to the present to talk about the three major heart attack risk calculators in use today.
Modern heart attack risk calculators: lifetime, ASCVD, and PREVENT
In 2025, there are three major heart attack risk calculators to choose from. They calculate not only 10-year risk, but also your lifetime risk of a heart attack. Here’s a summary of the three models:
| Calculator | Year | Key Features | Inputs Needed | What It Predicts | Accuracy |
|---|---|---|---|---|---|
| ASCVD Risk | 2013/2018 | - Current gold standard - Most widely validated - Used in treatment guidelines | Age, gender, total cholesterol, HDL, blood pressure, diabetes, smoking | 10-year risk of heart attack or stroke | 79% |
| Lifetime Risk | 2012 | - Long-term prediction - Age-independent - Race-free | Total cholesterol, blood pressure, smoking, diabetes, BMI | Lifetime risk of cardiovascular disease | 75-77% |
| PREVENT | 2023 | - Race-free equations - Uses zip code for social factors - Includes kidney function | Age, gender, zip code, cholesterol, blood pressure, eGFR, diabetes, smoking | 10-year risk of heart attack or stroke | 89% |
While all three heart attack risk calculators have a lot in common, there are also a few key differences.
Common risk calculators are simple multivariate models
All of these calculators have the same core structure: a multivariate model that combines a few key risk factors into a probability.
Here’s the formula used by the first model, the ASCVD calculator, to calculate your chances of having a heart attack (or other cardiovascular event) over 10 years:
10_year_heart_attack_risk = 1 - 0.8954 ^ exp(B)
  where B = 2.469 × ln(Age)
    + 0.000 × ln(Age)^2
    + 0.302 × ln(Total Cholesterol)
    + 0.000 × ln(Age) × ln(Total Cholesterol),
    + 0.000 × ln(Age) × ln(Hdl),
    - 0.307 × ln(HDL)
    + 1.916 × ln(Systolic BP) if untreated
    + 1.809 × ln(Systolic BP) if treated
    + 0.549 for smoking
    + 0.645 for diabetes
    - 19.54
There are four separate sets of coefficients: for black men, black women, white men, and white women. The ones shown above are for black men; the coefficients that are zero may be nonzero for the other demographic groups.
Calculating your lifetime risk of heart disease
Your risk of heart attack varies by age. For young people, the 10-year risk of a heart attack will nearly always be low—but plaque builds up in your arteries over your entire lifetime.
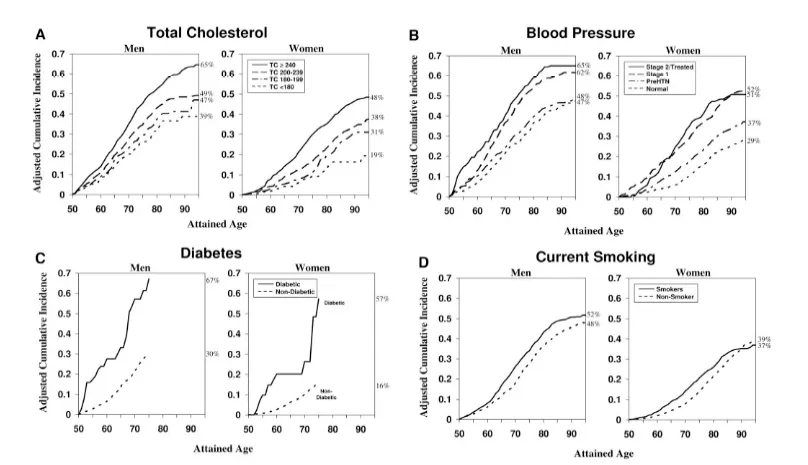
So what if we instead predicted your lifetime risk of a heart attack, stroke, or other cardiovascular event? The lifetime risk calculator was developed from the Framingham Heart Study by measuring blood biomarkers, and then following participants for up to 50 years. Published in 2012 in the New England Journal of Medicine, they found five factors strongly predict cardiovscular disease over your lifetime: total cholesterol, systolic and diastolic blood pressure, smoking status, and diabetes status.
 Source: Prediction of lifetime risk for cardiovascular disease by risk factor burden at 50 years of age, Lloyd-Jones et al.
People with optimal risk factors at age 45 had a remarkably low lifetime risk of heart disease: < 5% for women, < 10% for men. Those with two or more major risk factors had lifetime risks as high as 69%.
Race-free equations for heart attack risk prediction
The ASCVD equations have separate coefficients for White men, White women, Black men, and Black women. This is because, in the data, there are observed differences in cardiovascular outcomes between racial groups.
However, explicitly including race as a variable in the model creates several problems. First race represents a combination of genetic factors and social factors (e.g., how many hospitals or grocery stores with fresh food are near you); it’s more accurate to model these factors separately. Second, many races are simply excluded from the model—if you’re South or East Asian, for example, your doctor has had to make a judgement call on which coefficients to use for you, which may not be accurate. Some modern models try to eliminate race entirely as a variable. Instead, they replace race with factors that independently represent socioeconomic factors (e.g., your zip code) or physiological mechanisms that may have a genetic component (e.g., eGFR).
The PREVENT equations, introduced in 2023, are an example of the race-free approach: they include include eGFR and zip code.
- eGFR (estimated glomerular filtration rate) estimates how well your kidneys filter your blood. It’s essentially the amount of liquid per hour, and is calculated from blood biomarkers like creatinine. Zip code is used to estimate a social deprivation index, which is a proxy for social factors like access to healthy food, healthcare, and exercise.
Examples: calculating risk of heart attack by age and biomarkers
This can all seem rather abstract. How does real-world heart attack risk vary for young and older people with optimal risk factors vs elevated risk factors?
Here’s an example table, comparing four patient scenarios:
| Patient Description | 10-Year Risk (ASCVD) | 10-Year Risk (PREVENT) | Lifetime Risk |
|---|---|---|---|
| 25-year-old female with optimal risk factors | <1% | N/A | 8% |
| 30-year-old male with elevated blood pressure (135/85), high total cholesterol (240), low HDL (35), nonsmoker | 1% | 1% | 46% |
| 57-year-old male with diabetes (A1c of 8), high blood pressure (150/90), elevated total cholesterol (250), and low HDL (35) | 26% | 13.6% | 69% |
| 60-year-old female with well-controlled risk factors: blood pressure 120/75, total cholesterol 175, HDL 55, non-smoker | 3% | 5.6% | 8% |
These examples illustrate how age, gender, and risk factors combine to affect both short-term and lifetime cardiovascular risk. Note how young people can have very low 10-year risk despite poor risk factors, while their lifetime risk reveals the long-term impact of those same factors.
What’s a good cardiovascular risk score?
Generally, 5% or less a good risk score. In the 2018 ACC/AHA guidelines, medications like statins are reocmmended if if your 10-year risk is over 7.5%. If your risk is over 20%, then statins or other medications are strongly recommended.
How to calculate your risk of a heart attack risk by age
You can predict your risk of a heart attack by age using the ASCVD or PREVENT equations. The Empirical Health app will do this for you, and also let you model how your heart attack risk would go down with changes to nutrition, exercise, or medications.
Blood tests to predict heart attack risk
To test your heart attack risk, you need a blood test with lipids, your blood pressure, and your medical history. You might also consider more advanced biomarkers like ApoB, CRP, and Lp(a). We’ll talk about each of these in turn.
Core lipids: HDL and LDL cholesterol
For any of these calculators to work, you need, at the very least, total cholesterol, LDL and HDL cholesterol, and blood pressure numbers from a cuff (perhaps one day devices like Apple Watch will measure blood pressure). However, roughly half of all heart attacks happen in people with normal cholesterol levels.
Advanced biomarkers: ApoB, C-reactive protein, and Lp(a)
More advanced heart health tests include ApoB (more accurate than LDL), C-reactive protein (measures inflammation), and Lp(a) (a heriditary component of heart attack risk).
ApoB vs LDL cholesterol for heart attack risk
If you’ve read the work of Peter Attia or Thomas Dayspring, you’ll surely have heard of Apolipoprotein B (ApoB). While LDL cholesterol is calculated indirectly using the Friedewald equation (or its relatives), ApoB directly measures the number of atherogenic particles in your blood. Each atherogenic particle (like LDL, VLDL, or IDL) contains exactly one ApoB molecule, so advocates argue that ApoB is actually a more accurate predictor of heart attack risk than LDL or total cholesterol.
Why isn’t ApoB more common in heart attack risk calculators?
If ApoB is so great, why isn’t it part of these risk calculators? The answer is largely time lag. For example, the lifetime risk calculator, published in 2012, was based on data collected 50 years earlier. At that time, ApoB testing was not widely available. New guidelines recommend ApoB over LDL (e.g., the 2021 Canadian Cardiovascular Society statement), so we expect that risk calculators will be soon to follow.
C-reactive protein (inflammatory marker)
Inflammation is an independent risk factor for heart disease. High sensitivity C-reactive protein (hs-CRP) is a simple blood test that measures inflammation. While there are some risk calculators that include CRP, such as the Reynolds Risk Score, for the most part we use hs-CRP as an independent input to help inform concrete choices, such as whether to start a statin. The JUPITER Trial showed that in people with normal LDL, but high inflammation, statins reduced the risk of any vascular event by 44%.
Lp(a) (genetic marker)
Lipoprotein(a), or Lp(a), is a particle that causes atherosclerosis, and is primarily determined by genetics. You can think of Lp(a) as the “floor” of your LDL cholesterol based on your genetics (i.e., even with great diet and exercise, you won’t go below this floor). High Lp(a) might lead you to consider aggressive interventions (like statins) earlier. Low Lp(a) might lead you to focus on diet and exercise first.
How to calculate your own heart attack risk
Do you want to calculate your own heart attack risk? Empirical Health’s advanced heart health panel is a blood test that contains all the biomarkers you need to calculate your own heart attack risk.
 Empirical Health app: comprehensive heart health monitoring with Apple and Android watches
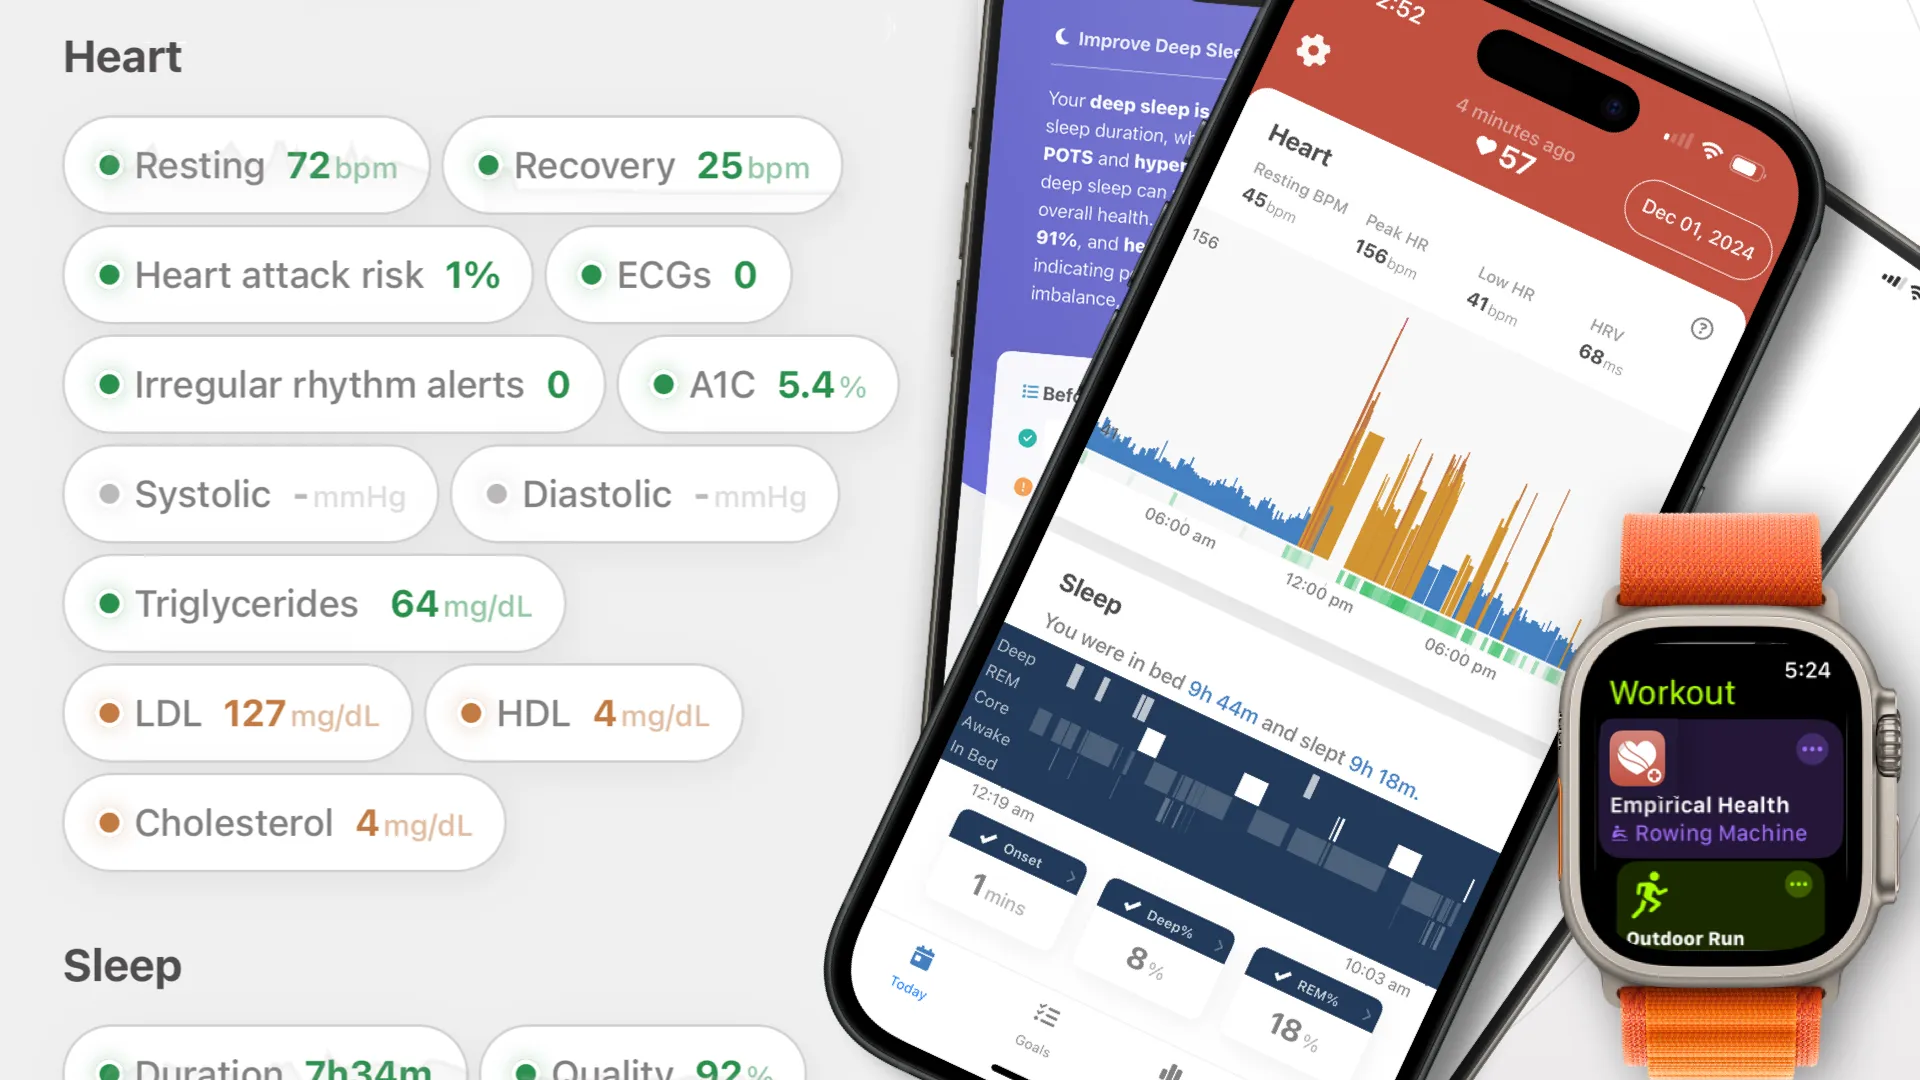
Once you complete your blood test, the Empirical Health app for iPhone and Android will calculate your heart attack risk, connect with a heart rate monitor (Apple Watch, Samsung, Pixel, etc), and help you track your progress over time.
In the coming posts, we’ll cover how to actually prevent a heart attack, including biomarker-driven nutrition, exercise and VO2Max, and the role of medications.
Get your free 30-day heart health guide
Evidence-based steps to optimize your heart health.
